Stratis DevEx: Getting started with C# smart contract static analysis and the portable graphical IDE extension
Introduction
In our first article on Stratis DevEx we looked at the Stratis .NET smart contract platform and the overall DevEx project goal of achieving parity between Ethereum smart contract development tools like Remix IDE, Solidity Visual Developer, Truffle VS Code, and Stratis C# smart contract development tools. We looked at the new Stratis.CodeAnalysis Roslyn analyzer and how it moves the existing Stratis smart contract validation process from a deploy-time command-line tool, to design-time with immediate visual IDE feedback on validation errors, using the static analysis capabilities of the .NET compiler platform (Roslyn). In this article we'll look at extending the types of static analysis we can do on C# smart contracts and how we can visualize the results of this analysis in a way that works across IDEs and operating systems.
Roslyn analyzers have a wide range of static analysis capabilities on C# code including control-flow analysis and data-flow analysis. However, their native user interface is limited to producing text diagnostics for display with source code, with a small number of fields like title, description, severity, and location, describing the problem detected by the analysis. For more advanced visualizations of C# static analysis like call graphs and control-flow graphs, we need a custom user interface that can graphically display the results of our static analysis and allow the user to interact with it.
The typical way of implementing custom user interfaces for C# development tools is to use IDE extensions. However, IDE extension development is a complex undertaking that is not portable between IDEs. Visual Studio, Visual Studio Code and JetBrains Rider each have their own extensibility models and languages, namely C#, JavaScript/TypeScript and Java. IDE extensions are as a general rule much more difficult to develop, debug, and maintain than regular programs and these extensions generally offer little in the way of code reuse and portability across environments.
The Roslyn analyzer environment is flexible enough to accommodate sending data to external programs as the user enters code in the editor hosting the analyzer and the code is compiled and analyzed. We can take advantage of this to build a portable C# IDE extension that provides a graphical user interface for static analysis that works across IDEs and across operating systems.
Stratis DevEx GUI
The Stratis.DevEx.GUI project provides a cross-platform GUI application server for interactively viewing the results of C# static analysis performed by the Stratis.CodeAnalysis C# analyzer. The GUI receives data from the analyzer in real-time as the environment compiles the code and runs the different static analyses available and then sends the results to the GUI which renders it graphically allowing the user to interact with it.
This approach is a portable, more flexible alternative to writing a Visual Studio or Visual Studio Code et.al IDE extension. The DevEx GUI is a standard .NET desktop application with no limitations on the kinds of controls or features you can use, that runs on Windows, Linux, and Mac, and works with any .NET IDE that supports Roslyn analyzers. The DevEx GUI can also be extended for any kind of smart contract development task, like deploying and executing smart contracts on a local development node.
Running the DevEx GUI
The following steps will get you started with the DevEx GUI:
Ensure you have .NET 6.0 installed for your operating system.
Clone the repo:
git clone https://github.com/stratisdevex/Stratis.DevEx --recurse-submodulesRun
buildor./build.shfrom the repo root. This will build both the Stratis.CodeAnalysis analyzer and the GUI application server. The builds should complete without errors.To run the GUI, run
devex-gui --debugor./devex-gui --debugto start the GUI application server in debug mode: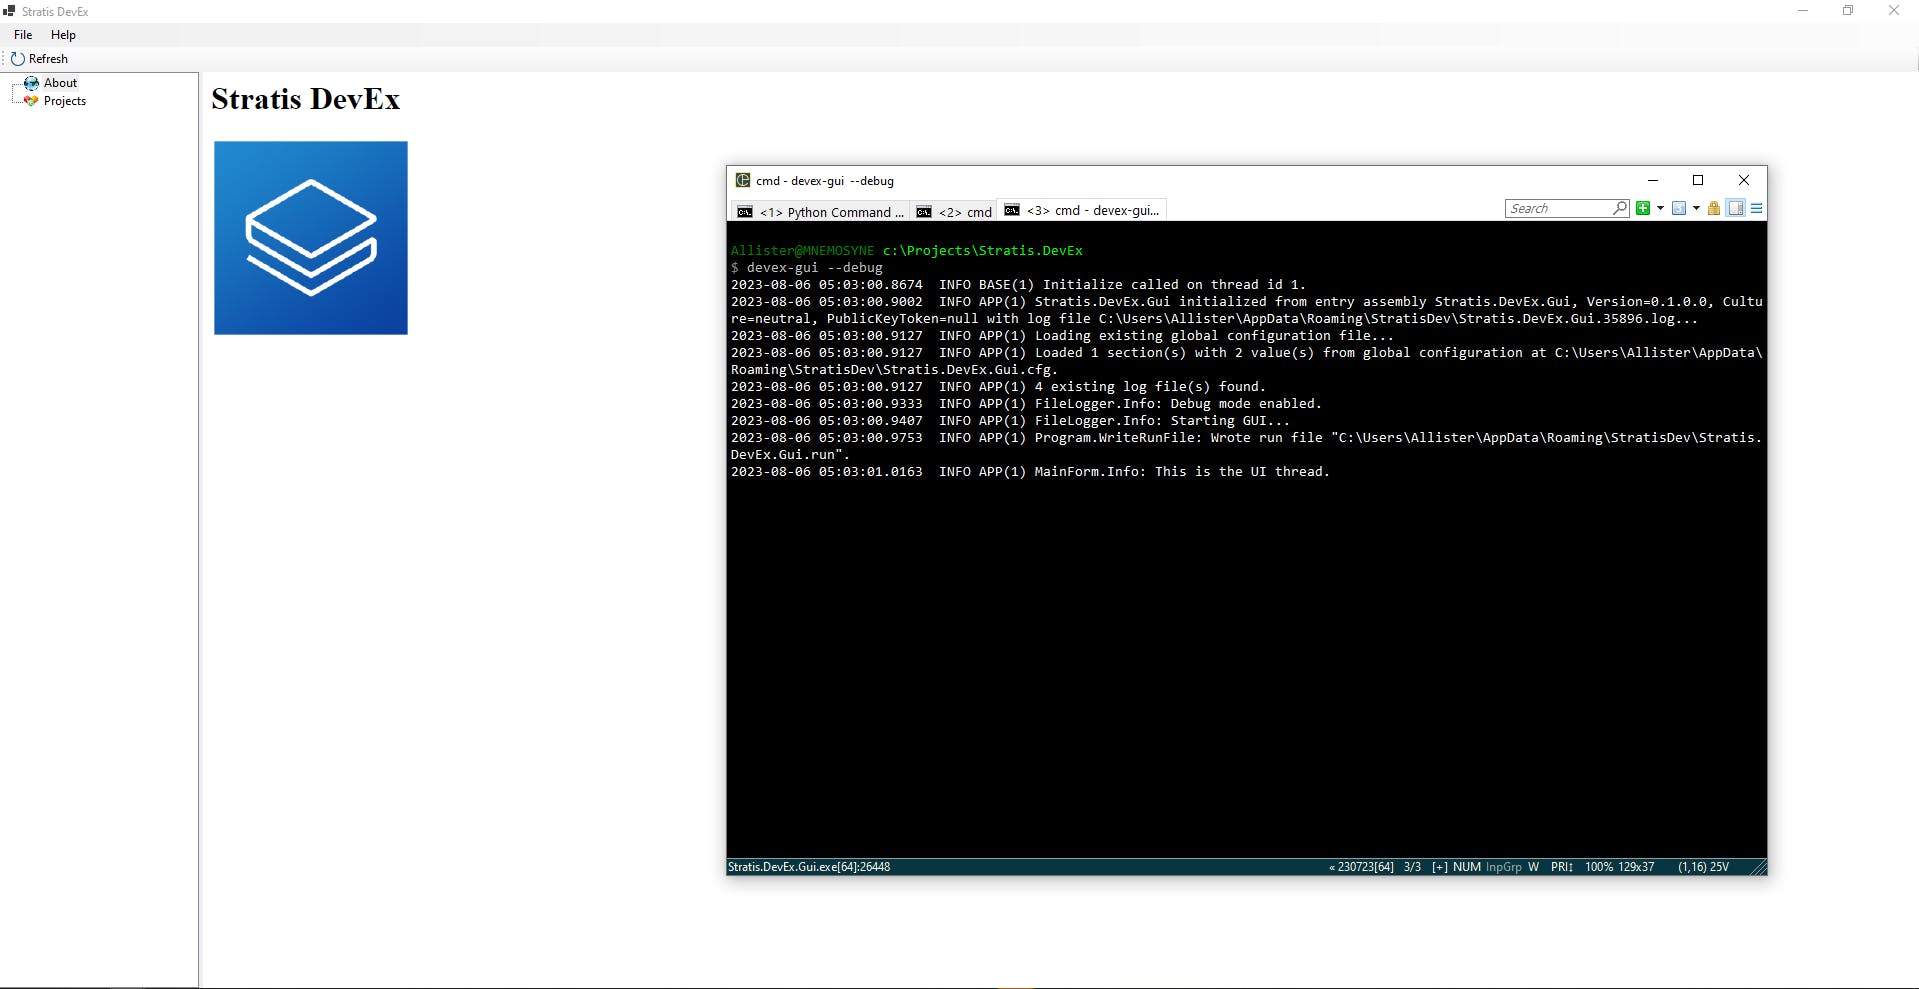
You'll need to add the Stratis DevEx NuGet feed to the NuGet package sources on your machine to allow IDEs like Visual Studio or JetBrains Rider to provide the ability to install packages from this feed. The simplest way to do this is to add the source to a user-wide or machine-wide NuGet.Config like the one at %appdata%\NuGet\NuGet.Config or $HOME/.nuget/NuGet/NuGet.Config:
<packageSources>
    ...
    <add key="Stratis DevEx" value="https://www.myget.org/F/stratisdevex/api/v3/index.json" protocolVersion="3" />
With this NuGet source added you will be able to install the Stratis.CodeAnalysis analyzer into your smart contract project in IDEs like JetBrains Rider:
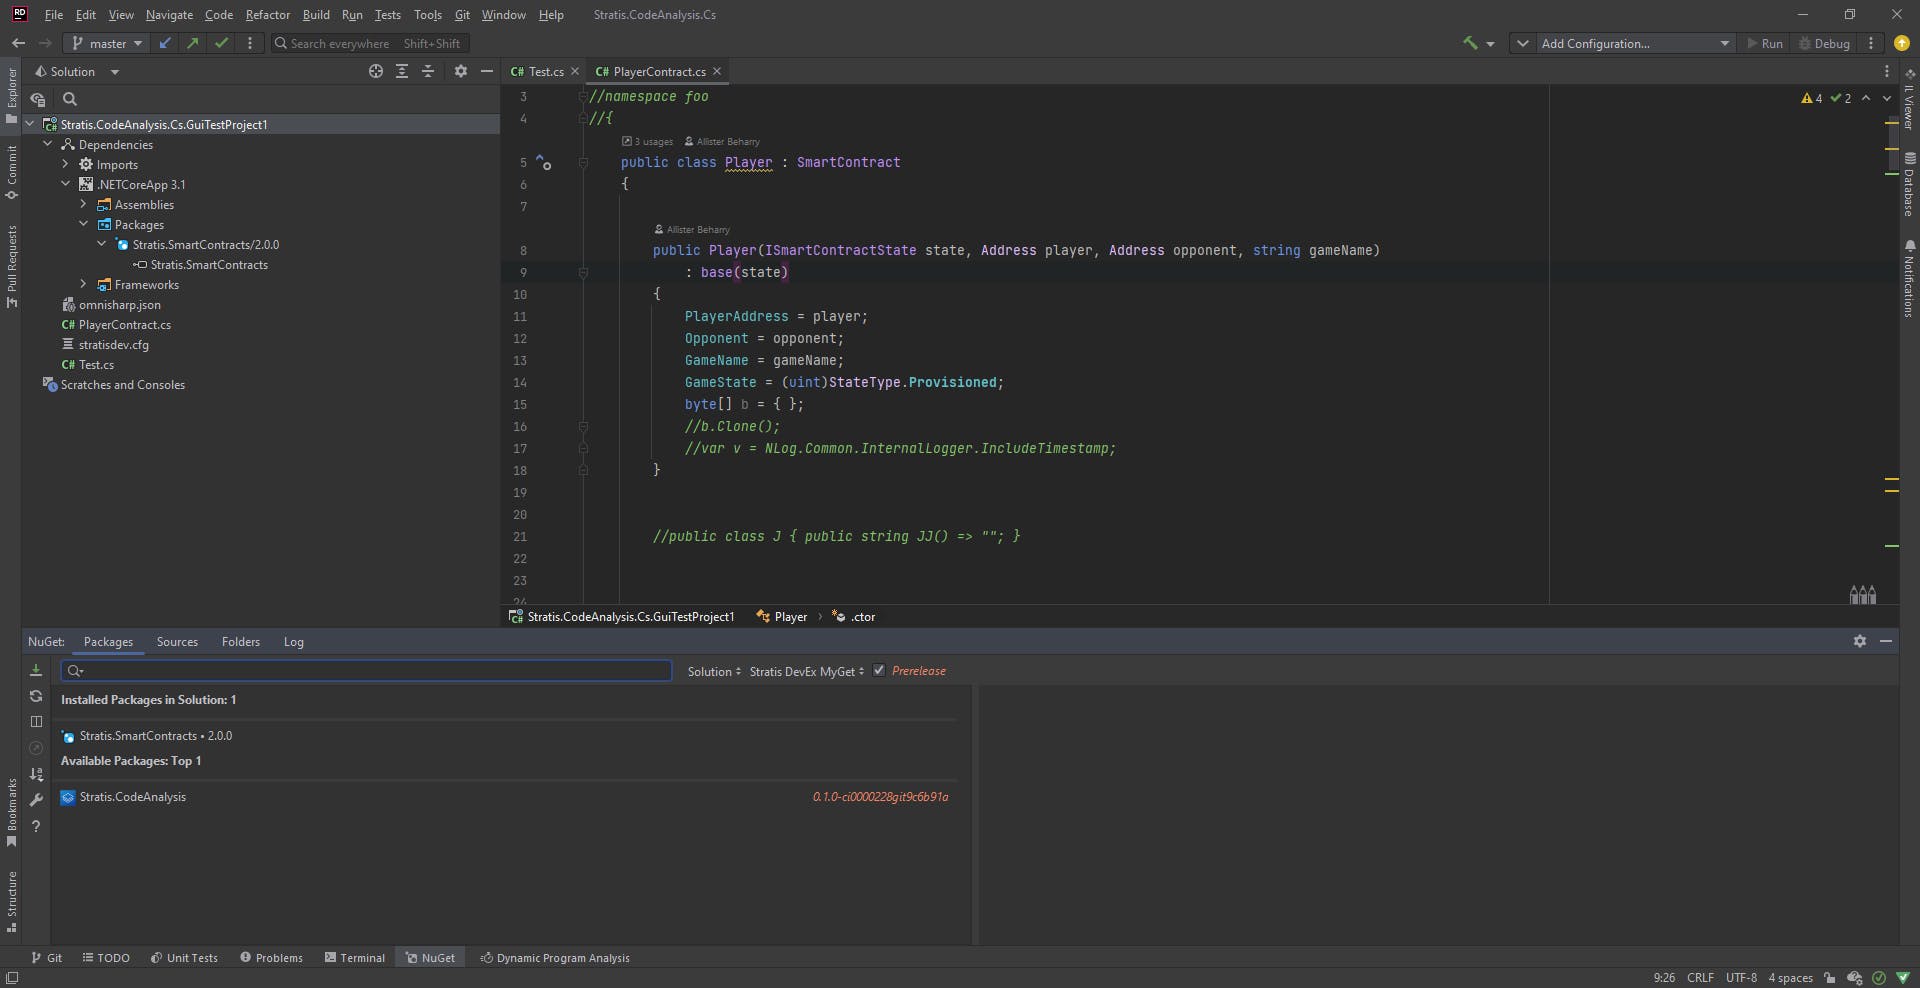
In Rider and Visual Studio make sure you select the option to view prerelease NuGet packages from feeds. If everything is configured right you should see the latest version of the Stratis.CodeAnalysis package available to install into a smart contract project:
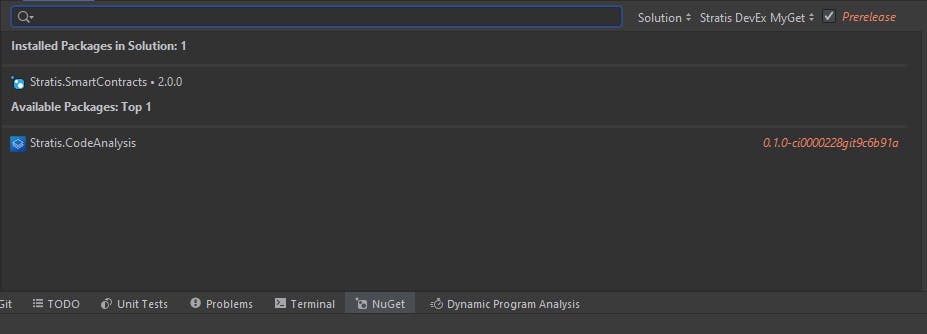
In Rider, select the Stratis.CodeAnalysis package, then click on the + icon in the right pane to install the package into your smart contract package:

In Visual Studio you should see the Stratis.CodeAnalysis package available to install into your project from the NuGet Package Manager user interface:

Visual Studio Code requires some additional steps to use Roslyn analyzers. First ensure the "Dotnet>Server: Use Omnisharp", "Omnisharp: Use Modern Net", and "Omnisharp: Enable Roslyn Analyzers" settings are all enabled for your workspace or project. Since VS Code doesn't have a package management GUI, you'll need to use the .NET CLI to install the Stratis.CodeAnalysis package. From a VS Code terminal window in your smart contract project's directory:
dotnet add package Stratis.CodeAnalysis --prerelease --source https://www.myget.org/F/stratisdevex/api/v3/index.json

This should install the latest version of the package into your project:
info : PackageReference for package 'Stratis.CodeAnalysis' version '0.1.0-ci0000230gitbee8d20' updated in file 'C:\Projects\Stratis.DevEx\tests\testprojects\Stratis.CodeAnalysis.Cs.GuiTestProject1\Stratis.CodeAnalysis.Cs.GuiTestProject1.csproj'.
info : Assets file has not changed. Skipping assets file writing. Path: C:\Projects\Stratis.DevEx\tests\testprojects\Stratis.CodeAnalysis.Cs.GuiTestProject1\obj\project.assets.json
log  : Restored C:\Projects\Stratis.DevEx\tests\testprojects\Stratis.CodeAnalysis.Cs.GuiTestProject1\Stratis.CodeAnalysis.Cs.GuiTestProject1.csproj (in 102 ms).
Once it is installed into your smart contract project, the analyzer should detect the GUI application server running and begin sending data to it:

GUI Features
The GUI shows smart contract projects from data sent by IDEs hosting the Stratis.CodeAnalysis analyzer. The left pane shows the smart contract assembly name and each C# source file that will be compiled in the smart contract project. The right pane has 4 views:
Summary: This view shows UML class diagrams of classes, structs, and interfaces defined in your smart contract project, with their public and private members and composition and inheritance relations:

Control-Flow Graph: This view displays control-flow graphs of each method in a class consisting of basic block nodes connected by branch edges. The graph view can be zoomed and panned and individual nodes dragged and rearranged:

Call Graph: This view displays call graphs of methods within a smart contract project. Like the CFG view, the call-graph view can be zoomed and panned and individual nodes dragged and rearranged:
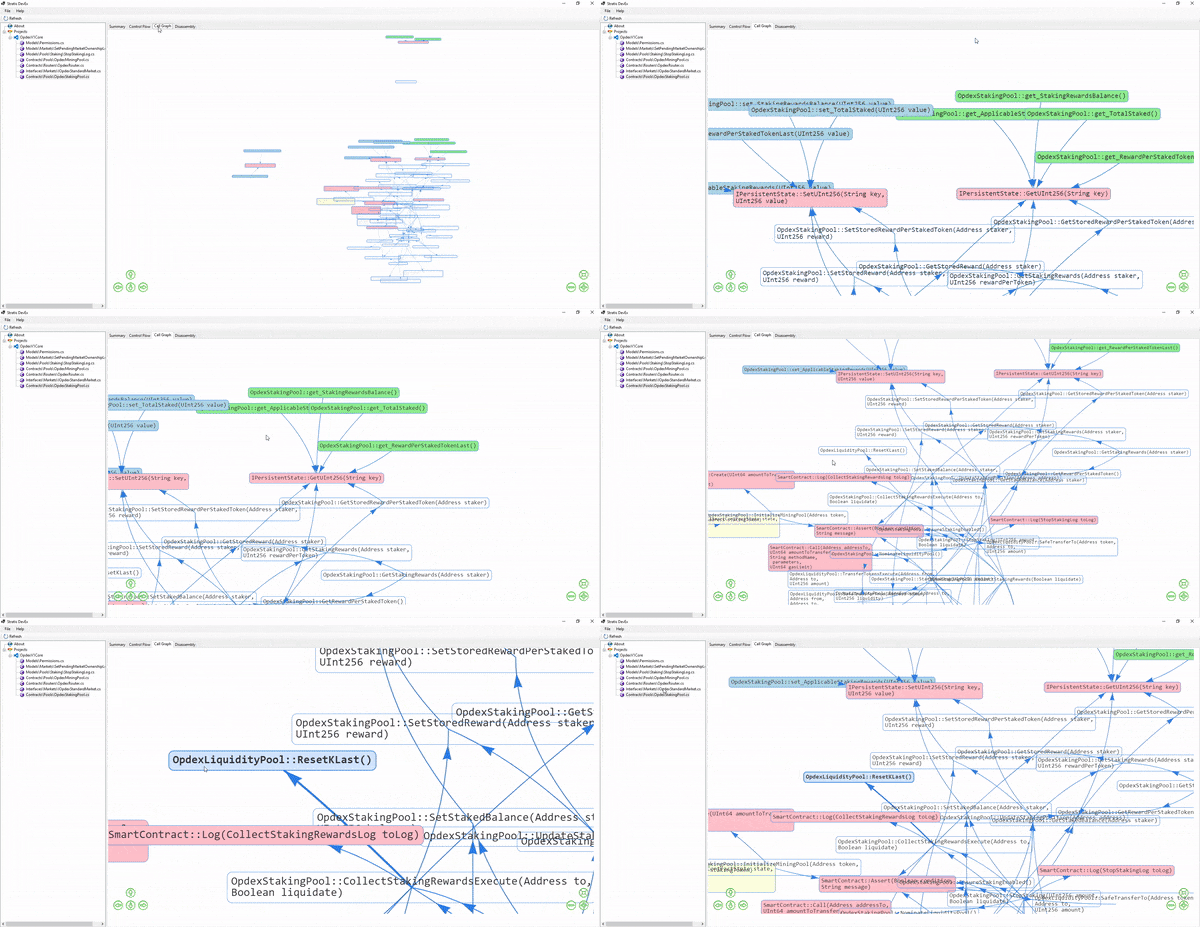
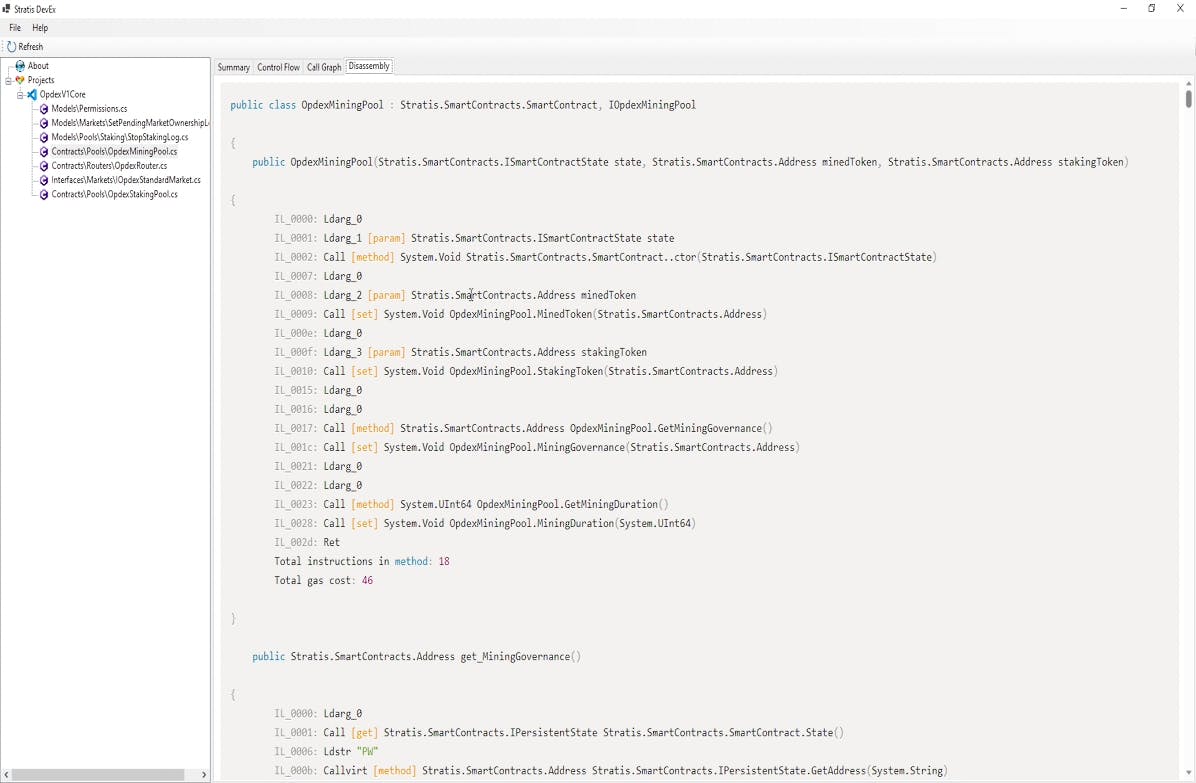
Disassembly: This view displays the CIL instructions of the smart contract code, together with an instruction count and the gas cost. These are the instructions that will be executed by the smart contract VM at runtime:
Other static analysis types and views supported by Roslyn like data-flow analysis will be added. These types of static analyses can be very useful in helping to understand and secure complex smart contract code.
How it works
Each Roslyn analyzer has access to a number of events raised by the C# IDE during the editing and compilation of a C# project. For simplicity, we will just consider the Compilation event which is handled by actions registered using the RegisterCompilationAction method of the AnalysisContext when the analyzer is initialized. The Compilation event handler runs every time the environment is able to do a successful incremental or full compilation of the project's source code meaning whenever you make a change to the source and there aren't any syntax or other errors anywhere in the project, the Compilation handler action will run. The lone parameter sent to the action is a CompilationAnalysisContext object which contains all the details of the compilation stored in the Compilation object, such as the list of source files compiled, the syntax trees parsed and generated for each C# source file, and the semantic model created for each syntax tree that contains type and symbol info resolved by the compiler for the syntax nodes of the tree e.g. the semantic model can tell us what the return type of a method declaration syntax node is after considering all the files and references of the entire compilation.
With the semantic models of a compilation, we can also do flow analysis like control-flow graph analysis of methods. We can build control-flow graphs consisting of basic blocks of instructions and branches leading into and out of each block which give a graphical representation of the control flow inside each method
The .NET compiler platform gives us the static analysis APIs and types for things like control-flow graph analysis, but we still need a way to visually present the results of the analysis to the user and allow the user to interact with it. The way we do this is by sending the static analysis data via IPC to an application server running in a separate process which then is responsible for displaying a GUI for the data. The application server GUI responds to the real-time data sent by the analyzer and updates its state to match the analysis data and documents and the compilation state of the editor hosting the analyzer.
C# Static Analysis
We can look at one type of static analysis in detail -- call graph analysis -- and how it's implemented in the Stratis.CodeAnalysis Roslyn analyzer. For each class declaration C# syntax node we first collect all the method member symbols from the semantic model:
ClassDeclarationSyntax[] classdecls =
                            model.SyntaxTree.GetRoot()
                            .DescendantNodes()
                            .OfType<ClassDeclarationSyntax>()
                                   .ToArray();
...
foreach (var c in classdecls)
{
    var t = model.GetDeclaredSymbol(c);
    var className = t.ToDisplayString(SymbolDisplayFormat.MinimallyQualifiedFormat);
    ...
    foreach (var method in t.GetMembers().Where(m => m.Kind == SymbolKind.Method).Cast<IMethodSymbol>())
    {
                    // Collect Method Information
                    var methoddata = new Dictionary<string, object>();
                    methoddata["name"] = method.MetadataName;
                    if (method.ContainingNamespace != null && !string.IsNullOrEmpty(method.ContainingNamespace.Name))
                        methoddata["name"] = method.ContainingNamespace.Name + "." + method.MetadataName;
                    methoddata["name"] = className + "::" + (string)methoddata["name"];
For each method symbol we then look at every method invocation syntax node, retrieve the method symbol with the name and type and parameter info of the invocation from the semantic model, and store this as a node in the call graph:
var invocations = method.DeclaringSyntaxReferences.First().GetSyntax().DescendantNodes().OfType<InvocationExpressionSyntax>();
//For each metinvocation within our method, collect information
foreach (var invocation in invocations)
{
    var invokedSymbol = model.GetSymbolInfo(invocation).Symbol as IMethodSymbol;
    if (invokedSymbol == null) continue;

   var n = invokedSymbol.ContainingSymbol.ToDisplayString(SymbolDisplayFormat.MinimallyQualifiedFormat) + "::" + invokedSymbol.MetadataName;
   paramBuilder.Clear();
   paramBuilder.Append("(");
   foreach (var p in invokedSymbol.Parameters)
   {
       paramBuilder.AppendFormat("{0} {1}", p.Type.Name, p.Name);
       paramBuilder.Append(",");
    }
    if (invokedSymbol.Parameters.Count() > 0)
    {
        paramBuilder.Remove(paramBuilder.Length - 1, 1);
    }
    paramBuilder.Append(")");
    n += paramBuilder.ToString();
    if (invocationList.Any(i => (string)i["method"] == (string)methoddata["name"] && (string)i["name"] == n))
        continue;

    var invocationInfo = new Dictionary<string, object>();
    invocationInfo["name"] = n;
    invocationInfo["method"] = methoddata["name"];
    invocationList.Add(invocationInfo);
Each invocationInfo object contains the source method data node of the caller and the target method data node of the invocation or callee (at the "method" and "name" keys respectively.) This data is then sent over IPC to the GUI.
GUI I/O
The analyzer communicates with the GUI application server using named pipes. Named pipes provide a full-duplex message-based IPC mechanism that allows one or more clients to communicate simultaneously with a server. DevEx uses the Async Named Pipe Wrapper for .NET Standard 2.0 library which provides a high-level API over .NET pipe operations.
After each full or incremental compilation of a smart contract project in an IDE, the analyzer gathers data via static analysis, serializes this data, and sends it over a named pipe to the GUI application server:
if (GuiProcessRunning() && !pipeClient.IsConnected)
{
    Debug("Pipe client disconnected, attempting to reconnect...");
    pipeClient.ConnectAsync().Wait();
}
if (GuiProcessRunning() && pipeClient.IsConnected)
{
    var mp = MessageUtils.Pack(m);
    pipeClient.WriteAsync(mp).Wait();
    ...
}
GUI Framework
The DevEx GUI uses Eto Forms as its main GUI framework, which allows you to "build applications that run across multiple platforms using their native toolkit, with an easy to use API." Eto Forms uses a pretty simple, traditional, GUI API oriented around regular C# code, controls and events, that doesn't use XAML or MVVM, and renders on supported platforms using native toolkits like Windows Forms or GTK.
Although we could use Eto Forms 2D drawing controls to render graphs, we can also take advantage of the terrific open-source graph layout libraries for Web applications to provide a feature-rich viewing and layout engine for our graph-based static analysis results.
Graph Layout
The DevEx GUI uses vis-network to provide layout and interactive viewing of control-flow graphs and call graphs in an embedded Eto Forms web view:
Each node of a control-flow graph or call graph is converted to a vis-network network node and has properties set that determines its appearance in the graph layout, like size, color, and mass.
foreach (var node in graph.Nodes)
{
    nodes.Add(new NetworkNode()
    {
         Id = node.Id,
         Label = node.LabelText,
         Font = new NetworkFont() { Face = "monospace", Align = "left" },
         Shape = nodeshape,
         Size = nodesize,
         Color = graph.Kind switch
         {
             "cg" => node.Attr.FillColor != Color.Transparent || node.Attr.Color != Color.White ?
                 new NetworkColor()
                 {
                     Background = node.Attr.FillColor.ToString().Trim('"')
                 } : null,
             "cfg" => GetCFGNodeColor(node),
             _ => null
         },
         Mass = graph.Kind switch
         {
             "cfg" => node.edgeSourceCount + node.edgeTargetCount switch
             {
                 var c when c <= 2 => 1.5,
                 var c when c > 2 && c <= 4 => 2.0,
                 var c when c > 4 && c <= 6 => 3.0,
                 _ => 4.0
             },
             "cg" => node.edgeSourceCount + node.edgeTargetCount switch
             {
                            var c when c <= 2 => 1.5,
                            var c when c > 2 && c <= 4 => 2.0,
                            var c when c > 4 && c <= 6 => 3.0,
                            _ => 4.0
             },
             _ => 1.0
         }
   });
}
The mass of an individual node affects how the node behaves in the network physics which simulates the nodes and edges as physical objects in a force field and moves them to show each as clearly as possible. In the above code, a node's mass increases depending on how many edge sources and targets it holds which increases the repulsion or how far other nodes in the graph are kept from it.
var physics = new NetworkPhysics()
{
    Enabled = true,
    HierarchicalRepulsion = new NetworkHierarchicalRepulsion()
    {
        AvoidOverlap = 2.0,
        NodeDistance = 250,
    },
    TimeStep = 0.5
};
Graphs are serialized as networks and then rendered in an Eto Forms webview using HTML and JavaScript:
var network = VisJS.Draw(graph);
var stringBuilder = new StringBuilder();
var divId = Guid.NewGuid().ToString("N");
stringBuilder.AppendLine("<html lang=\"en\"><head><script type=\"text/javascript\" src=\"https://unpkg.com/vis-network/standalone/umd/vis-network.min.js\"></script><title>Title</title><body>");
stringBuilder.AppendLine($"<div id=\"{divId}\" style=\"height:100%; width:100%\"></div>");
stringBuilder.AppendLine("</div>");
stringBuilder.AppendLine("<script type=\"text/javascript\">");
stringBuilder.AppendLine($@"
        let container = document.getElementById('{divId}');
        let data = {{
                        nodes: new vis.DataSet({network.SerializeNodes()}),
                        edges: new vis.DataSet({network.SerializeEdges()})
                    }};
        let options = {network.SerializeOptions()};
        let network = new vis.Network(container, data, options);
        ");
stringBuilder.AppendLine("</script>");
stringBuilder.AppendLine("</body></html>");
Disassembler
The DevEx GUI disassembles the .NET smart contract assembly byte stream emitted by a compilation to obtain the CIL instructions that will be executed by the smart contract VM, and to calculate the gas cost of executing a smart contract method. DevEx uses an updated version of Microsoft's Common Compiler Infrastructure (CCI) library, which is the precursor to the Cecil library and still a very capable .NET CIL analysis library, to disassemble smart contracts:
using Microsoft.Cci;
using Microsoft.Cci.ILToCodeModel;
...

using var host = new PeReader.DefaultHost();
IModule? module = host.LoadUnitFrom(FailIfFileNotFound(fileName)) as IModule;
if (module is null || module is Dummy)
{
    Error("{0} is not a PE file containing a CLR module or assembly.", fileName);
    return;
}
string pdbFile = Path.ChangeExtension(module.Location, "pdb");
using var pdbReader = new PdbReader(fileName, pdbFile, host, true);
...
 var options = DecompilerOptions.AnonymousDelegates | DecompilerOptions.Iterators | DecompilerOptions.Loops;
 module = Decompiler.GetCodeModelFromMetadataModel(host, module, pdbReader, options);
 var sourceEmitter = new SmartContractSourceEmitter(output, host, pdbReader, true);
 sourceEmitter.Traverse(module);
Conclusion
The Stratis DevEx GUI provides a portable IDE extension for displaying the results of smart contract static analysis performed by the Stratis.CodeAnalysis Roslyn analyzer in any compatible IDE. Static analysis data is sent in real-time over IPC to an external GUI application server in response to compilation events occurring in the environment hosting the analyzer. This approach is a simpler, more maintainable way to implement a custom extensible user interface for the interactive presentation of C# static analysis results across IDEs and operating systems.